Food Hygiene Report 2024 | UK Ratings | Towns, Cities & Regions
hero-image-food-hygiene-report-2024

Food Hygiene: Know the score 2024 Report

What are food hygiene ratings and how does your area perform?

Since 2008, we have certified over 3 million learners, training hundreds of thousands of people across the world on the topic of food hygiene.

All food businesses in the UK are provided with a Food Hygiene rating, ranking them on a scale of zero to five. These ratings are critical to both customers and business owners. The ratings allow consumers to understand an establishment's approach to hygienic practices and make informed decisions about where they choose to eat. Food Hygiene ratings also provide businesses an opportunity to underline their commitment to maintaining high standards to any potential customers.

To highlight the importance of these ratings, High Speed Training has investigated Food Standards Agency (FSA) data for over 215,000 food businesses across England, Scotland, Northern Ireland and Wales.

We conducted similar reports in 2022 and 2023, providing a picture of how the landscape of food hygiene standards have changed over the last few years. With this report, we will explore how ratings are decided, the importance of food hygiene, and why a business’ rating is something you should always have in mind when having a meal out or grabbing lunch on the go

The Results

By using the interactive map and table below, you can see how your region, town or city ranks against the rest of the country

Loading ...
Back
South West
East Counties
London
Wales
South East
North West
North East
West Midlands
East Midlands
Northern Ireland
Scotland
Yorkshire & Humber

Overall Results

You can filter these results by Region or by Town/City:

North East

Ranked joint #3 of 11

Yorkshire & Humber

Ranked #6 of 11

South West

Ranked #1 of 11

Wales

Ranked #8 of 11

East Counties

Ranked #5 of 11

East Midlands

Ranked joint #3 of 11

London

Ranked #10 of 11 (bottom)

North West

Ranked #7 of 11

Northern Ireland

Ranked #2 of 11

Scotland

Scotland uses a different rating system to the rest of the UK which has two main ratings - 'Pass' or 'Improvement Required'. We have provided the percentage pass rates by local authority below.

South East

Ranked #4 of 11

West Midlands

Ranked #9 of 11

What is the Food Hygiene Rating Scheme?

The Food Hygiene Rating Scheme (FHRS) is a partnership with local authorities in England, Wales & Northern Ireland, providing customers with valuable information about the hygiene standards of a food business.

Ratings are given to a premises following the visit of an Environmental Health Officer (EHO) or other authorised officer from the local authority. The frequency of these visits depends on the nature of the business. A premises that often handles fresh and raw food is considered at higher risk than one that only sells pre-packaged food, and so are visited more frequently to ensure hygiene practices are being followed.

The EHO will conduct an inspection of the establishment, then bestow a rating on the premises. The criteria and rating scale are summarised below.

What makes up a rating?

Hygienic food handling and practices

This covers how the business prepares, cooks, re-heats, cools and stores the food.

Physical condition of the premises and facilities

This ensures the location is clean, has an appropriate layout, adequate lighting, suitable ventilation, pest control and other facilities.

Confidence in Management

This evaluates if the business takes suitable precautions to keep food safe. This can include Hazard Analysis and Critical Control Point (HACCP) systems, staff training records and logs of relevant checks.

These 3 elements make up the overall food hygiene rating which is scored out of 5 as follows:

0 1 2 3 4 5

0 = Urgent Improvement Needed

0 1 2 3 4 5

1 = Major Improvement Needed

0 1 2 3 4 5

2 = Some Improvement Needed

0 1 2 3 4 5

3 = Satisfactory

0 1 2 3 4 5

4 = Good

0 1 2 3 4 5

5 = Very Good

A food hygiene rating sticker showing a 5 star rating for an establishment.

These ratings are made available on the Food Standards Agency (FSA) website and are often visible from outside of the premises, usually presented in a window near the entrance. This is an example of a Food Hygiene Rating sticker, which you will regularly see displayed.

In Wales and Northern Ireland, it is compulsory for businesses to display their food hygiene rating. However, in England, it is currently just considered best practice.

Scotland's Food Hygiene Information Scheme

In Scotland, a similar scheme, called the Food Hygiene Information Scheme (FHIS), evaluates businesses on their food hygiene practices. After an EHO has reviewed the safety systems, observed food hygiene in practice and spoken with the staff, the businesses are given either:

Scotland Scheme Pass Image

Pass

The business meets the legal standard of food hygiene.

or

Scotland Scheme Improve Image

Improvement Required

The legal standard of food hygiene was not evident during the inspection. The business will need to improve certain areas to then qualify for a pass.

As in England, the FHIS is available to view online, though it is not required by law for a business to display their rating.

Key Findings

Top 3 overall towns and cities

1
Southport
4.91
2
Bangor
4.89
3
Ipswich
4.89

Top 3 overall regions

1
South West
4.66
2
Northern Ireland
4.64
3
East Midlands
4.62

Top 3 overall large cities

1
Nottingham
4.75
2
Brighton and Hove
4.69
3
Bristol
4.60

20% of takeaways in England, Wales and Northern Ireland had a food hygiene rating of 3 or below

9 out of 11 regions in the UK improved their average food hygiene score from 2023

480 food establishments in England, Wales and Northern Ireland scored a zero for their food hygiene rating

70.5% of food establishments in the UK scored a 5 on their FH rating, with 87.7% scoring 4 and above, a higher percentage than in 2023

Average rating across England, Northern Ireland and Wales rose to 4.55 from 4.53 in 2023

The average Pass rate in Scotland is 92.5%, a slight increase from 2023

Findings by region

We have compiled a list of key facts for each region of England, along with Northern Ireland, Scotland and Wales. Select a region from the options to get specific findings for where you live.

East Counties

5th In regional rankings
4.59 average score
  • Overall region change:
  • 2023: 4.58 - 2024: 4.59
Show details
  • Ipswich remains the highest rated town or city in the East Counties region, and the third highest rating of all towns and cities in the UK, with an average rating of 4.89.
  • St Albans saw the largest ratings improvement in the region, improving from an average rating of 4.27 in 2023 to a rating of 4.41 in 2024.
  • Luton ranked lowest in the region, with an average score of 4.33.
  • The number of rated premises in the region fell from 19,417 in 2023 to 18,707 in 2024.
  • 16% of takeaways in the region scored a 3 or below.
  • 91% of restaurants are rated 4 or 5, and 96% of hotels, B&Bs and guest houses are rated 4 or 5.
  • 10% of establishments are rated 3 or lower.
Show details

East Midlands

3rd In regional rankings
4.62 average score
  • Overall region change:
  • 2023: 4.61 - 2024: 4.62
Show details
  • The East Midlands (3rd, average of 4.62) performed significantly better than the West Midlands (9th, average of 4.42).
  • Lincoln has the highest average rating in the East Midlands region with an average of 4.89.
  • Northampton has the lowest rating in the East Midlands region with an average of 4.29, though that rating has increased from 4.19 in 2023.
  • No town or city in the region improved their rating more than Mansfield, increasing by 0.17 from 2023 to an average of 4.62.
  • 18% of takeaways in the region have a rating of 3 or lower.
  • Almost 90% of establishments scored 4 or 5 for their food hygiene rating.
  • The number of rated premises in the region fell from 16,245 in 2023 to 15,758 in 2024.
Show details

London

10th In regional rankings
4.36 average score
  • Overall region change:
  • 2023: 4.34 - 2024: 4.36
Show details
  • Compared to other UK region’s, London has the lowest average food hygiene rating in the UK, averaging 4.36.
  • Kensington and Chelsea has the highest rating of all the London Boroughs with an average of 4.80.
  • Waltham Forest has the lowest rating of London boroughs, with an average rating of 3.74, down 0.03 from 2023.
  • If London boroughs were counted as separate towns, one would claim each of the three bottom spots in the country - Barking and Dagenham: 3.95, Ealing: 3.92, Waltham Forest: 3.74.
  • Rexbridge has the highest average rating increase in London from 2023, improving its rating by 0.14 to 4.38 climbing to 13th in the region in the process.
  • Westminster placed 11th with an average rating of 4.43 coming from over 3,700 establishments.
  • The number of rated premises in the region rose from 34,961 in 2023 to 35,832 in 2024.
Show details

Yorkshire and Humber

6th In regional rankings
4.57 average score
  • Overall region change:
  • 2023: 4.53 - 2024: 4.57
Show details
  • Rotherham is top of the Yorkshire and Humber rankings with an average rating of 4.81, with the second highest increase (0.16) of any town or city in the country.
  • This places the South Yorkshire town 6th in the overall UK rankings.
  • Halifax has the lowest average rating of all major towns and cities in the Yorkshire and Humber region, with an average rating of 4.20.
  • Harrogate, Ripon and Barnsley all saw their ratings drop from 2023, with Harrogate losing top spot in the region for the first time.
  • The biggest cities in the region: Leeds (4.58), Sheffield (4.54), and Bradford (4.40) placed 7th, 9th and 12th in the regions respectively, with all three increasing their rating.
  • 1 in 10 establishments in the region scored 3 or below.
  • Almost 1 in 5 takeaways (18%) in Yorkshire and Humberside scored a 3 or below.
  • 91% of restaurants, cafes and canteens in Yorkshire and Humber scored a 5.
  • The number of rated premises in the region fell from 21,402 in 2023 to 21,051 in 2024.
Show details

West Midlands

9th In regional rankings
4.42 average score
  • Overall region change:
  • 2023: 4.41 - 2024: 4.42
Show details
  • Newcastle-Under-Lyme has the highest rating in the West Midlands region with an average of 4.77, placing it in the top 10 nationally.
  • Birmingham has the lowest rating in the West Midlands region with an average of 4.08, though their rating has increased from 4.03 in 2023.
  • 1 in 4 takeaways in the region scored a 3 or below for their rating.
  • 38% of takeaways in Birmingham were rated 3 or below, with 10% rated 1 or lower.
  • Burton upon Trent had the highest increase in the region, improving by 0.16 from 2023 to 4.74.
  • 85% of premises scored a 4 or 5 for their rating.
  • The number of rated premises in the region fell from 17,905 in 2023 to 17,724 in 2024.
Show details

North East

5th In regional rankings
4.62 average score
  • Overall region change:
  • 2023: 4.59 - 2024: 4.62
Show details
  • Stockton-on-Tees has the highest rating in the North East region with an average of 4.86.
  • Hartlepool slips to second, dropping by 0.02 to 4.83.
  • No town or city in the North East has a lower average rating than 4.41 overall, the highest in England.
  • Newcastle won the Tyne-Wear derby over Sunderland with an overall average rating of 4.51 vs 4.49.
  • Sunderland increased their rating by a region high 0.15 from 2023.
  • 90% of premises in the region scored a 4 or 5 for their rating.
  • The number of rated premises in the region fell from 9,843 in 2023 to 9,564 in 2024.
Show details

North West

7th In regional rankings
4.46 average score
  • Overall region change:
  • 2023: 4.44 - 2024: 4.46
Show details
  • Southport has the highest average food hygiene rating of all towns and cities in the UK, with an average rating of 4.91.
  • Wigan has the lowest average rating in the country, and the highest drop in ratings, dropping by 0.29 from 2023 with a rating of 3.92.
  • Manchester triumph in the big local derby, with a rating of 4.34 compared to Liverpool’s 4.32.
  • 85% of premises in the region scored a 4 or 5 for their rating.
  • The number of rated premises in the region fell from 27,383 in 2023 to 27,170 in 2024.
Show details

South East

4th In regional rankings
4.61 average score
  • Overall region change:
  • 2023: 4.60 - 2024: 4.61
Show details
  • Hastings retains the top spot in the South East region with an average of 4.84.
  • Slough is bottom of the region’s rankings, with an average score of 4.39, losing 0.08 from its 2023 rating.
  • High Wycombe saw the greatest improvement in the region, improving its rating from 4.37 in 2023 to 4.48.
  • 90% of premises in the region scored a 4 or 5 for their rating.
  • The number of rated premises in the region fell from 29,455 in 2023 to 28,897 in 2024.
Show details

South West

1st In regional rankings
4.66 average score
  • Overall region change:
  • 2023: 4.66 - 2024: 4.66
Show details
  • Bournemouth has the highest rating in the South West region with an average of 4.81.
  • Exeter loses its top spot from 2023, slipping to 3rd with an average rating of 4.75.
  • Bath has the lowest average rating in the region, with a rating of 4.36.
  • The largest city in the region, Bristol, placed 6th with an average rating of 4.6.
  • 92% of premises in the region scored a 4 or 5 for their rating.
  • The number of rated premises in the region fell from 21,474 in 2023 to 21,056 in 2024.
Show details

Wales

8th In regional rankings
4.45 average score
  • Overall region change:
  • 2023: 4.42 - 2024: 4.45
Show details
  • Gwynedd has the highest average rating in Wales, just as they did in 2022 and 2023, scoring 4.83.
  • Blaenau Gwent has the lowest rating in Wales with an average of 3.91. It is one of only two regions (Merthyr Tydfil, 3.95) in Wales with a rating below 4.
  • Rhondda Cynon Taf had the biggest rating increase, by 0.14 to 4.09.
  • 86% of premises in the region scored a 4 or 5 for their rating.
  • The number of rated premises in the region fell from 13,584 in 2023 to 13,115 in 2024.
Show details

Northern Ireland

2nd In regional rankings
4.64 average score
  • Overall region change:
  • 2023: 4.68 - 2024: 4.64
Show details
  • Northern Ireland has the second highest rating (4.64) of all regions in the UK, losing its top spot from 2023.
  • Northern Ireland was the only region/country in the UK that recorded a drop in ratings, losing 0.04, with 7/10 regions recording a decline in rating.
  • Mid and East Antrim and Lisburn and Castlereagh City have the highest ratings in the country, with an average of 4.77.
  • Fermanagh and Omagh recorded the biggest ratings drop from 2023, by 0.12 to 4.59.
  • Belfast City came bottom of the NI rankings, scoring 4.52, a drop of 0.10 from 2023.
  • 92% of premises in the region scored a 4 or 5 for their rating.
  • The number of rated premises in the region fell from 6,631 in 2023 to 6,456 in 2024..
  • Belfast has the third highest average rating in the whole of the UK when compared with other larger towns and cities (with over 1,000 establishments).
Show details

Scotland

N/A In regional rankings
N/A average score

In Scotland, businesses are assessed by an EHO and receive a ‘Pass’, or an ‘Improvement required’ notice. The below stats are the percentage of businesses that received a ‘Pass’.

  • Overall region change:
  • 2023: 92.13% - 2024: 92.5%
Show details
  • The average pass rate for Scotland has risen from 92.13% in 2023 to 92.5% in 2024.
  • South Ayrshire ranks highest in Scotland with a pass rate of 99.81%.
  • The Shetland Islands rank lowest in Scotland in the latest food hygiene ratings report, with a pass rate of 74.71%, following a drop of 2.74%.
  • Moray saw the biggest improvement, climbing by 5.16%.
  • East Lothian saw the biggest drop, of just over 3%.
  • Edinburgh ranks 25th in Scotland for food hygiene, with a pass rate of 90.31%.
  • Glasgow ranks 27th in Scotland for food hygiene, with a pass rate of 89.29%.
  • The number of rated premises in Scotland grew slightly, from 20,809 in 2023 to 20,961 in 2024.
Show details

For Customers

It’s up to you

Running a business that is hygienic and safe for customers is a legal duty of premises in the UK. However, as we’ve established, businesses in England do not have to legally display their food hygiene ratings, so it is often up to the customer to check these ratings to ensure that the premises are maintaining good standards of hygiene.

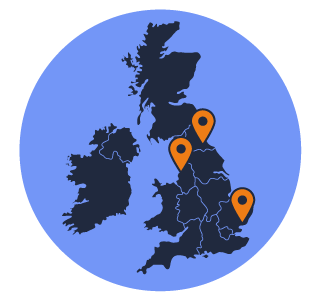
An audit published by the FSA in 2023 found that a third (33%) of businesses in England were not displaying their food hygiene rating, compared to only 13% in Northern Ireland and 9% in Wales. It also found that in England, businesses with a rating of 5 were more likely than average to display a sticker (77%), while those with a rating of 4 (43%) or 3 (39%) were less likely.

Due to these figures, there is an increasing call for England to follow Northern Ireland and Wales and require businesses to display their ratings to help customers make more informed choices.

Keeping yourself safe from food poisoning

Food poisoning is caused by eating food that has been contaminated by germs or bacteria. This can happen if food is not cooked or reheated thoroughly, is stored incorrectly or left out for too long. It can also happen if food for consumption is is handled by someone who's ill or has not washed their hands or food is eaten after its "use by" date.

In recent years, hospital admissions for some common illnesses linked to food poisoning have reached their highest levels in decades. In the period between April 2022 and March 2023, NHS data shows 1,468 admissions for salmonella infection, and 4,340 for campylobacter infections, a bacterial infection thought to be the most common cause of gastroenteritis in the world and the most common cause of food poisoning in the UK.

These figures highlight the need for consumers to be vigilant when it comes to hygiene standards, and underline the importance of a good food hygiene rating.

A key Takeaway

According to our data, 1 in 5 takeaways in England, Wales and Northern Ireland have a hygiene rating of 3 or lower, although this rises to an incredibly high 37% in some cities. Compare this to only 10% of restaurants and less than 5% of hotels, and you can see that many takeaways drastically need to improve their standards.

Only One Third of the Rating is Based on the Hygienic Handling of Food

As we’ve seen, three individual components that make up a food hygiene rating. One-third of the rating considers the building’s physical attributes and one-third takes into account the food safety management systems in place. Not all of these concern the physical handling of food, however.

If your favourite restaurant scores less than a five, it doesn’t necessarily mean they are preparing your food unhygienically. For example, issues such as peeling paint within the premises can affect the business’s overall ratings.

This is why it’s important to do your research; the FSA’s website provides a detailed breakdown of an establishments rating, detailing a score in each category. This can give you a better idea of the factors behind the rating, so you can be more confident when eating there.

For Businesses

Customers Care

Businesses must take food hygiene ratings seriously. A poor rating can have a significant impact on your business.

A recent report by the FSA found that “46% of respondents ‘always’ or ‘most of the time’ looked for the FHRS ratings” when choosing where to eat, meaning that a poor rating could potentially harm your business.

As we’ve seen, businesses that score lower on their ratings are more likely to not display their rating publicly, which could lead potential customers to assume that a premises has poor levels of hygiene.

The FSA actively encourages marketing a good rating to attract customers and it’s clear why. Attaining and advertising a good food hygiene rating can have a significantly positive impact on the number of customers who choose to use your services and therefore the profit you make.

One Poor Inspection Can Hurt

Even if your establishment currently has a good food hygiene rating, a bad score from the past can continue to negatively impact business. It can take up to six months for premises to be re-visited following an unsatisfactory rating and there are further delays in the change in rating being reflected publicly. Therefore, there may be a discrepancy between a rating online and one displayed on a building and businesses could be losing customers despite having improved their standards since the last inspection.

If you want to make sure you are fully prepared for an EHO inspection, download our free inspection checklist and check out our online Level 3 Food Hygiene Course, which is recommended for everyone aiming to achieve a 5-star food hygiene rating.

Faking Your Food Hygiene Rating Isn't Worth It

Displaying a false food hygiene rating is illegal under the Unfair Trading Regulations 2008, and can result in severe punishments, including sizable fines.

Within the last year, two businesses in West London were caught displaying false food hygiene ratings, and a cafe in Burton was caught displaying a rating of five when it actually had a rating of one.

In 2022, a restaurant in Farringdon was fined for “unauthorised” use of the highest food hygiene rating on the company’s website, as well as on Deliveroo and UberEats. The restaurant itself was fined £10,000 and the owner was charged £5000. Furthermore, both parties were also ordered to pay costs of £20,650 to Islington Council, proving that penalties for false food hygiene advertising are too high to risk.

If you feel as though a recent inspection hasn't reflected your usual standards, use our guide to find out how to appeal your food hygiene rating.

Methodology

Data was downloaded in March 2024 from the official Food Standards Agency ‘UK food hygiene rating data API’ which details the overall food hygiene ratings, rating components, and inspection results of food establishments across the UK.

The Food Standards Agency data attributes each establishment with one of fourteen business types. Of these business types, four were selected for inclusion. These were:

  • Restaurants/Cafes/Canteens
  • Takeaways/Sandwich Shops
  • Pubs/Bars/Nightclubs
  • Hotels/Bed & Breakfasts/Guest Houses

After filtering, if a business did not have a current rating or an inspection result then the entry was omitted from the analysis.

This resulted in a filtered total of businesses, equalling 215,327 establishments that fell within these categories and which were then used for the overall ranking analysis.

The regions selected for analysis in this report are the same twelve regions as used by the Food Standards Agency, and so businesses were split according to the region associated with their business.

The cities and towns being compared were selected from records held by the Office for National Statistics and the National Archives.

To match the food hygiene ratings provided for businesses by the Food Standards Agency we performed postcode lookups through the use of an online database, allowing us to match the postcodes of businesses with their closest major city or town, and the major city or town with their region. If a business did not have a valid postcode, then the entry was omitted from our analysis.

Following this, we amalgamated the food hygiene ratings of each town and city to provide an aggregate rating of food hygiene ratings for an area.

Following the data download, and after cities and towns were matched to rated businesses by postcode, several steps were taken to ensure the data was clean and fit for purpose.

In several instances, to ensure that the data was of interest to certain regions, the local authorities (as defined by the Food Standards Agency) of a region were used to split a region into further areas instead of using a city/town split. However, to provide clarity, in the overall rankings only cities and towns are listed.

As mentioned above, entries in the data downloaded from the Food Standards Agency without a valid postcode were omitted from analysis.

Following the cleaning of the data, several lists were created with cities/towns in each region ranked according to their mean food hygiene ratings and then subsequently ranked according to their overall rank in the UK - leading to the lists you are presented with here.

Food Standards Agency food hygiene ratings information, data and services are subject to the terms of the Open Government Licence (OGL).

The ratings are subject to change as they are regularly updated to reflect the standards found when a business is inspected by a local authority food safety officer.

Our study contains public sector information licensed under the Open Government Licence v3.0.

High Speed Training would like to thank the Food Standards Agency and the Office for National Statistics.

For press and media enquires, please contact Dan Raymond, PR Manager at High Speed Training, at daniel.raymond@
highspeedtraining.co.uk

You can also Download the Press Pack